Examples
Examples
![Practical demonstrations of Mol* Viewer visualization capabilities.]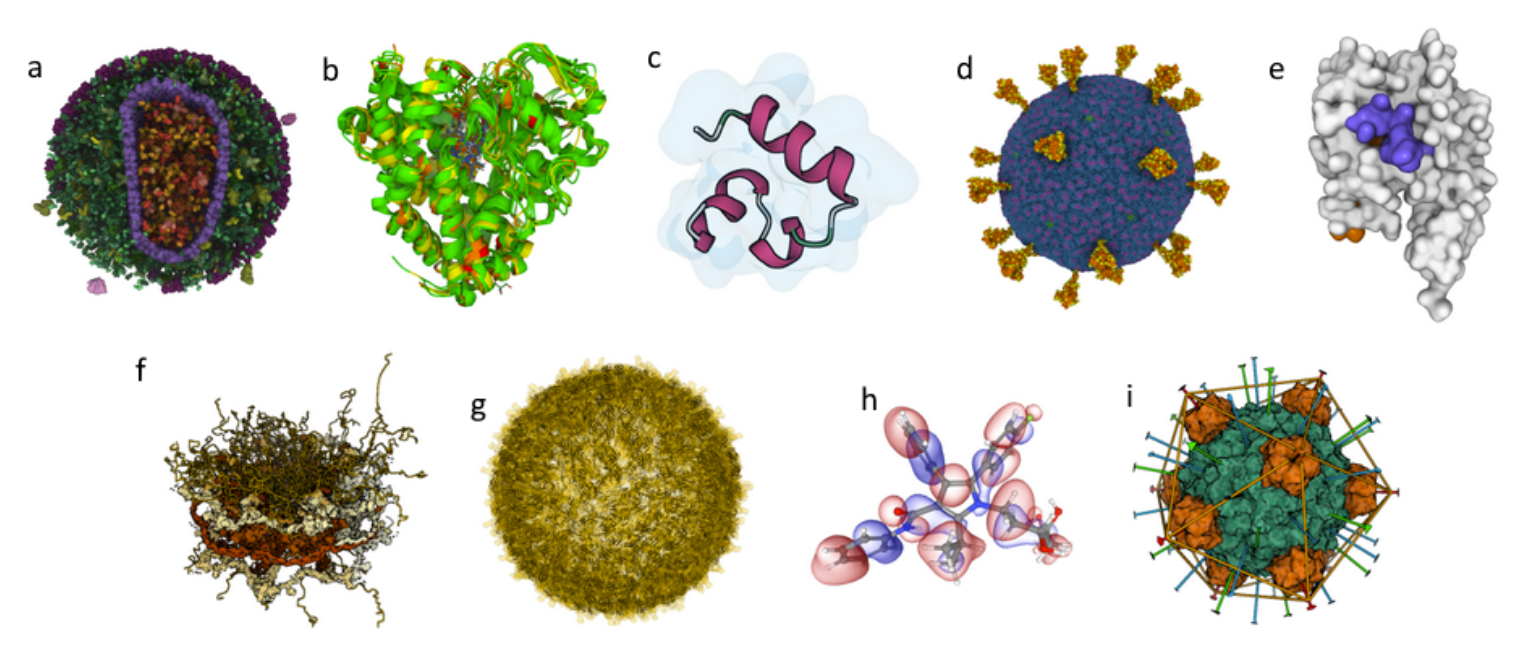
We prepared several use cases that can be accessed from the Mol* web page (https://molstar.org):
A. Enveloped HIV capsid in a blood serum: originates from CellPack and includes more than 13 million atoms.
B. Superimposition of cytochromes P450: the superimposed structures are colored according to a structure quality annotation, based on wwPDB validation reports.
C. Villin un/folding simulation: Part of a set of molecular dynamics trajectories for Markov state model analysis along villin headpiece folding and unfolding pathways. (doi.org/10.6084/m9.figshare.12040257.v1 and https://pubs.acs.org/doi/full/10.1021/acs.jctc.6b00049)
D. SARS-CoV-2 Virion: Coarse-grained model composed of glycosylated S-proteins, M-proteins, E-proteins, and a lipid bilayer (https://dx.doi.org/10.1016%2Fj.bpj.2020.10.048).
E. GAIN domain tethered agonist exposure simulation: Molecular dynamics trajectory (doi.org/10.1016/j.molcel.2020.12.042).
F. Nuclear pore complex: hybrid model originating from PDB-DEV and including 238,288 unique residues.
G. Zika virus assembly including its Cryo-EM density: The original size of the data is about 1.6 GB.
H. Molecular orbitals and electron density of atorvastatin: a visualization of molecular orbitals and the electron density computed locally on a GPU from the provided basis and eigenvectors.
I. DNA binding protein assembly: a protein assembly showcasing the RCSB PDB assembly symmetry annotation.
Based on the RCSB PDB mol* documentation thanks to the generosity of RCSB PDB and Dr. Shuchismita Dutta.